
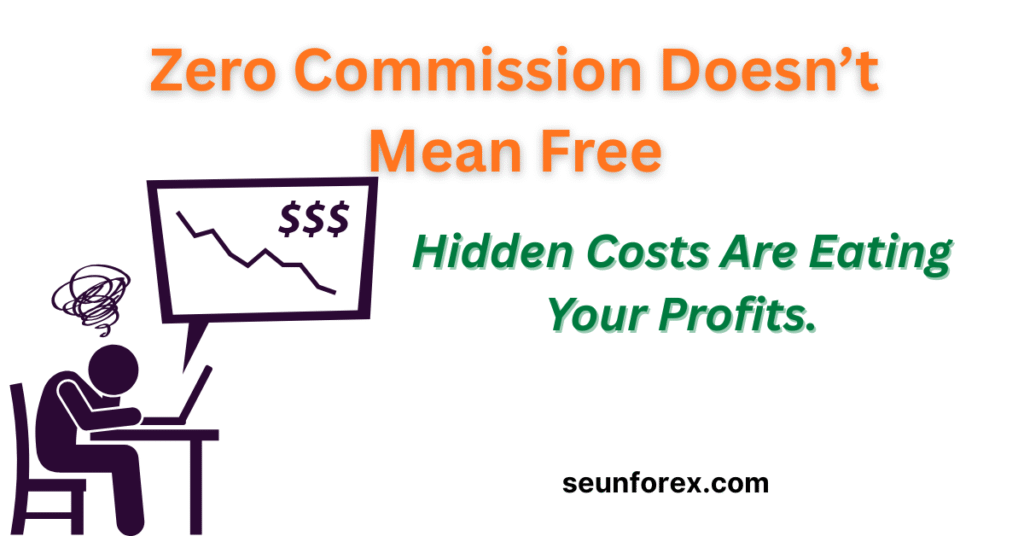
Introduction: The Illusion of Free Trades
Zero commission broker offers often seem like a free and effortless way to trade. Imagine standing on the shoreline, watching waves lap gently at your feet. The water looks calm, inviting, almost harmless. You step in, and the surface feels free, effortless. But beneath, currents twist, shifting sands pull, and unseen pressures tug you in ways you can’t predict.
For most retail traders, zero-commission trading appears free, obvious, and harmless. Yet the real currents—the forces that move money—aren’t on the surface. They’re deeper, subtle, and carefully designed by brokers to generate billions quietly, often while traders believe they’re saving every penny.
The truth: a zero commission broker isn’t about generosity. It’s about leverage, data, and hidden costs trading you don’t immediately notice. This article is a deep dive showing why “free” trades are rarely free—and how traders can spot and navigate these hidden costs.
🧠 The Broker’s Deep Dive: Understanding the Hidden Mechanics
Traders often focus on visible costs: commissions, account fees, platform charges. But the real broker profits live in the shadows, invisible unless you actively study them. Think of brokers like Wall Street chess players: every move designed to earn revenue, often without the trader noticing.
Here’s how zero-commission brokers make money:
1. Payment for Order Flow (PFOF)
- What it is: Brokers sell your orders to market makers, who execute them for a tiny profit on the spread.
- Why it matters: Your “free trade” may be filled slightly worse than the current market price. Over thousands of trades, those pennies add up.
- Example: If your trade is 0.1 cent worse than the national best bid or offer, you lose $1 per 1,000 shares. Multiply by millions of traders, and market makers—and brokers—profit massively.
2. Spread Widening
Even if a broker advertises zero commission, the spread—the difference between the buy and sell price—can be slightly higher. That’s invisible unless you track it. Tight spreads might be advertised on popular tickers, but thinly traded stocks and options often have wider gaps.
Illustration: Tesla may show a $0 spread on high-volume days. A microcap biotech ticker may have a $0.15–$0.25 spread, which seems small but can be catastrophic when trading frequently.
3. Interest on Cash Balances
Brokers hold customer cash and earn interest. Your uninvested cash becomes revenue for them. If you leave $10,000 sitting in your account, your “free” trade indirectly funds broker profit via interest—even if you’re earning nothing.
This is why many “zero-commission” brokers push you toward cash sweep programs or high-yield products—they monetize idle cash while making it appear beneficial for you.
4. Margin Lending
Leverage is profitable for brokers. Every time you trade on margin—even a “commission-free” trade—they charge interest on borrowed funds. Traders often underestimate this hidden cost.
Example: Borrowing $5,000 at 8% annual margin interest may cost $10–$15 per week if used frequently, far exceeding the $5 commission you supposedly saved.
5. Data Monetization
Every click, every trade, every ticker you watch is data. Brokers aggregate and sell this anonymized trading behavior to hedge funds, institutions, and analytics firms. “Free” trades are data-gathering mechanisms.
Even your order patterns—whether you favor morning trades, size of positions, tickers scanned—can be monetized indirectly. Think of it as free labor disguised as “free trades.”
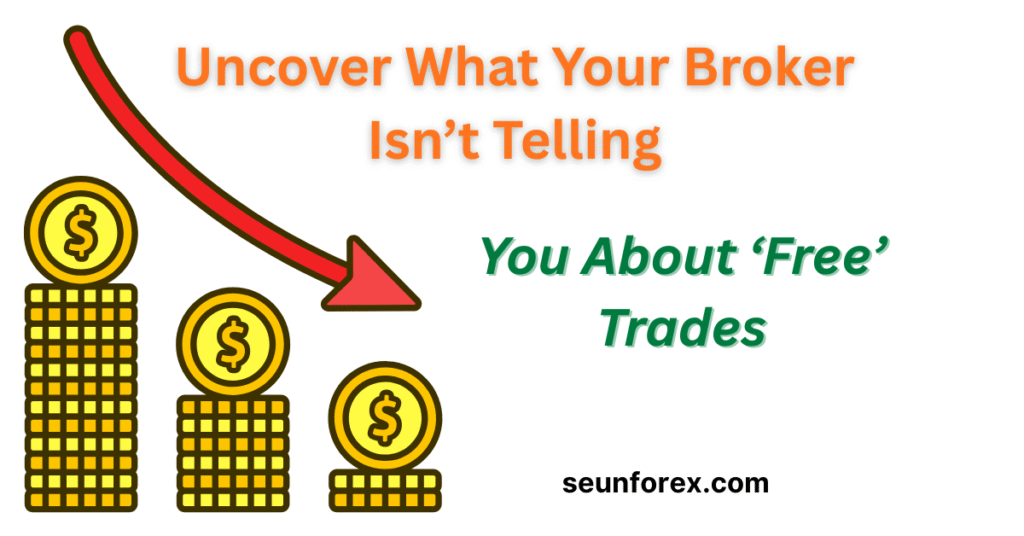
🎯 What “Zero Commission” Really Means
Let’s debunk the common perception: a zero commission broker does not mean your trade is truly free.
Case Study: Broker A advertises zero commission on equities. On paper, it looks like savings. But when we compare execution prices and spreads historically over 12 months, traders using zero commission brokers paid an average of 0.15% more per trade than a low-cost commission broker with PFOF transparency. This illustrates how hidden costs trading can quietly reduce your profits.
Psychology: Traders focus on the obvious savings (“I saved $5!”) rather than the hidden costs (“I lost $15 in execution slippage”) that accumulate over time.
Analogy: It’s like receiving a coupon for a free coffee but unknowingly paying a higher price for the coffee beans. The surface-level win masks the underlying cost.
In other words, zero commission brokers engineer the appearance of generosity while retaining the lion’s share of revenue indirectly. Recognizing these hidden costs trading practices is critical for every serious trader.
🧩 The Brain Science of Trading & Broker Incentives
Traders are wired to notice obvious things and ignore subtle ones—a concept called salience bias. A zero commission broker may look flashy and appealing, but the real cost comes from the hidden costs trading that are often ignored, like spreads, execution latency, or margin interest.
Behavioral insights:
- Anchoring Bias: Traders anchor on “$0 commission” and underestimate total costs, failing to account for the indirect fees from a zero commission broker.
- Loss Aversion: Traders dislike small, visible fees but are less sensitive to invisible slippage or margin interest embedded in hidden costs trading.
- Behavioral Exploit: Because trades feel free, traders often trade more frequently, unknowingly increasing risk and giving brokers more data and interest revenue.
Analogy: It’s like playing chess while only paying attention to the front three ranks of your opponent’s pieces. The queen is hiding behind the pawn structure, ready to capture unnoticed.
Trader takeaway: To trade profitably, you need to train your perception—not just your strategy. You must recognize hidden costs trading and understand the subtle mechanics of a zero commission broker, like a deep-sea diver feeling the pressure changes below calm water.
🧪 A Step-by-Step “Trader Awareness” Deep Dive
Just like studying a chart pattern, you can systematically study the hidden costs of zero-commission brokers. Here’s a practical framework:
Step 1: Historical Spread Comparison
- Collect trade data over 6–12 months.
- Measure average spreads for high-volume and low-volume tickers.
- Compare execution price vs. national best bid/offer.
Expected insight: Many “free” trades cost more than $0.01 per share in effective spread over time.
Step 2: Slippage Tracking
- Track every trade’s expected vs. actual fill price.
- Calculate the cumulative effect over 100, 500, 1,000 trades.
Expected insight: High-frequency traders or active swing traders can lose 0.05%–0.2% per trade, quietly eroding profit.
Step 3: Order Execution Speed
- Time your trades against market fluctuations.
- Even millisecond delays can result in missed opportunities, particularly in fast-moving momentum trades.
Example: Tesla gaps after earnings—execution delay of 500ms can change the fill price by $0.50–$1.
Step 4: Margin Costs Analysis
- Calculate interest on borrowed funds per trade.
- Include compounding effects if using daily margin.
Pro insight: Frequent leveraged traders may unknowingly pay more in interest than they saved in commissions annually.
Step 5: Non-Trading Monetization
- Consider all ancillary broker revenue streams: account cash balances, data subscriptions, premium tools.
- Quantify the indirect “cost” of being in their ecosystem.
Goal: Transform second-hand beliefs (“free trades save money”) into first-hand conviction based on numbers.
🧰 Practical Tools & Tactics
To run a broker deep dive, traders need tools:
- Spreadsheet Tracking: Record every trade’s execution, spread, slippage, and margin cost.
- Broker Comparison: Create a table comparing all zero-commission brokers for hidden costs.
- Historical Analysis Tools: Use APIs (Interactive Brokers, Alpaca, TD Ameritrade) to download past fills and analyze differences.
- Visualization: Overlay spreads and slippage on charts for intuitive understanding.
Workflow hacks:
- Hotkeys to step back/forward bars quickly.
- Columns for sector/industry, price, liquidity—sort and slice.
- Keep a running “Top 100 Cost Insights” deck.
📊 Quantifying the Hidden Cost
Here’s a sample trader deep-dive calculation:
| Metric | Value | Insight |
|---|---|---|
| Commission per trade | $0 | Visible savings |
| Average spread cost | $0.08/share | Hidden cost |
| Average slippage | $0.05/share | Execution cost |
| Margin interest per trade | $0.02/share | Hidden financing cost |
| Data monetization impact | Indirect | Behavior tracked, monetized |
Total effective cost per trade: $0.15/share (invisible to trader)
Over 1,000 shares per month × 12 months, this becomes $1,800 in hidden costs, dwarfing the saved $0 in commissions.
🧭 Common Mistakes Traders Make
- Chasing “free trades” blindly.
- Ignoring cumulative hidden costs.
- Over-trading due to perceived zero cost.
- Confusing surface-level savings with true net profitability.
- Neglecting order execution quality and latency.
✅ Closing Checklist: Run Your Broker Deep Dive Like a Pro
- Select one broker at a time.
- Collect historical execution, spread, and slippage data.
- Calculate indirect costs: margin, interest, data monetization.
- Quantify hidden cost per trade.
- Compare against competitors.
- Forward-test with small positions.
- Refine strategy to maximize efficiency and minimize invisible losses.
Dive deep, surface with clarity, and treat zero-commission offers as what they are: a lesson in market perception, not a free lunch.
For a deeper understanding of why brokers are racing to zero commissions and the hidden revenue streams they rely on, see this detailed breakdown from Investopedia: Online Broker Race to Zero Fees ✅
Key Takeaways
- Zero commission ≠ free. Always calculate hidden costs.
- Payment for order flow, spreads, margin interest, and data are brokers’ invisible profit streams.
- Traders are psychologically biased toward obvious savings, ignoring subtle losses.
- A trader-aware deep dive transforms perception into numbers, rules, and actionable strategy.
To see how professional traders turn data from every trade into actionable rules and marketing insights, check out our guide here: Prop Firm Trading as Marketing Tool